
 CRE Agents
Data and data sources
The live market, property and location data your tasks pull in, in plain words.
Tasks pull in the data they need while they run. You don’t have to find it, export it or paste it in. Ask for the work, and the numbers come with it.
What’s available
Section titled “What’s available”Markets and the economy
- Underwriting benchmarksCap rate, rent, expense, vacancy and financing ranges for 12 property types, adjusted for class, market, vintage and location.
- Interest ratesThe Treasury curve, SOFR and its forward curve, market rates, and an indicative all-in debt rate.
- Economic indicatorsNational series on inflation, construction costs, wages, housing, credit and consumer demand.
- EmploymentCounty jobs and wages, with momentum scores and a demand read by property type.
- Residential permitsNew housing permits by county and metro, with a supply pressure score.
People and places
- DemographicsPopulation, income and housing for any address, a radius, or a whole market.
- MigrationWhere households and income are moving, county by county.
- Retail spendingStore density, consumer spending and demand-gap scores by ZIP and county.
- Retail locationsChain store locations across the US, updated weekly, with history.
- PlacesFind nearby businesses and points of interest around a site.
- Traffic countsDaily traffic on the roads next to a site.
- Labor shedThe labor pool, wages and commute patterns around one or more sites, with a 10-year labor cost view.
- Student housingEnrollment and housing demand for every US college and university.
- CrimeReported crime for any US location, from FBI data going back decades.
Property records
- Parcel recordsOwner, size, use and assessor facts for any US parcel.
- Sales historyRecorded sales and transfers for any parcel, with comparable sales nearby.
- Property taxesAssessed values, exemptions and tax bills by year.
- Mortgages and liensRecorded loans, liens and foreclosures, with an estimated loan-to-value.
- Property screeningList properties across an area by use, owner and recent sales.
- Single-family and small residentialOwner, tax and sale history, plus value and rent estimates for homes and small rentals.
- New York City buildingsBuilding facts, energy use, sales, taxes and permits for NYC properties.
- ZoningZone, permitted uses and development rules for any US or Canadian address.
Multifamily
- Multifamily searchFind an apartment property in a national multifamily index.
- Multifamily property detailsBuilding facts, amenities, quality scores and current asking rents by unit type.
- Multifamily comparablesThe most similar apartment properties to a subject, ranked.
Risk, incentives and costs
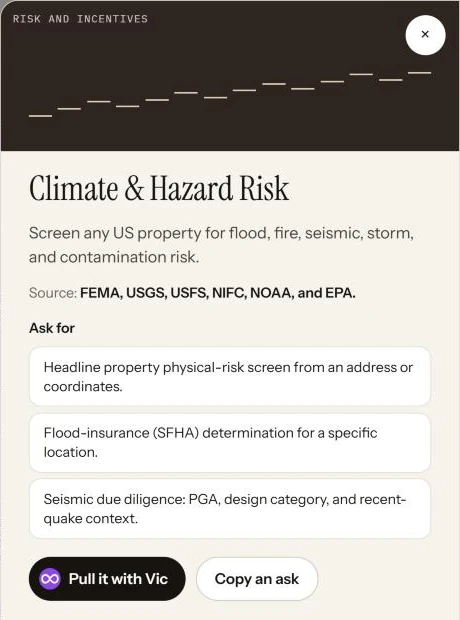
- Physical riskFlood, seismic, climate and contamination risk for any address.
- Federal incentivesOpportunity Zones, LIHTC tracts and other federal overlays at any location.
- Affordable housing (LIHTC)LIHTC properties, income and rent limits, and preservation risk.
- Energy and utility costsElectricity and natural gas prices by state and sector, plus water and sewer bills for 50 metros.
Maps and media
- Site mapsAerial photos, comp maps and data maps, ready to drop into a deliverable.
- Brand assetsLogos, colors and company facts for any business.
- Video transcriptsThe transcript of any YouTube video.
- Website authorityA 0 to 100 score for how established a website is.
Browse it in the portal
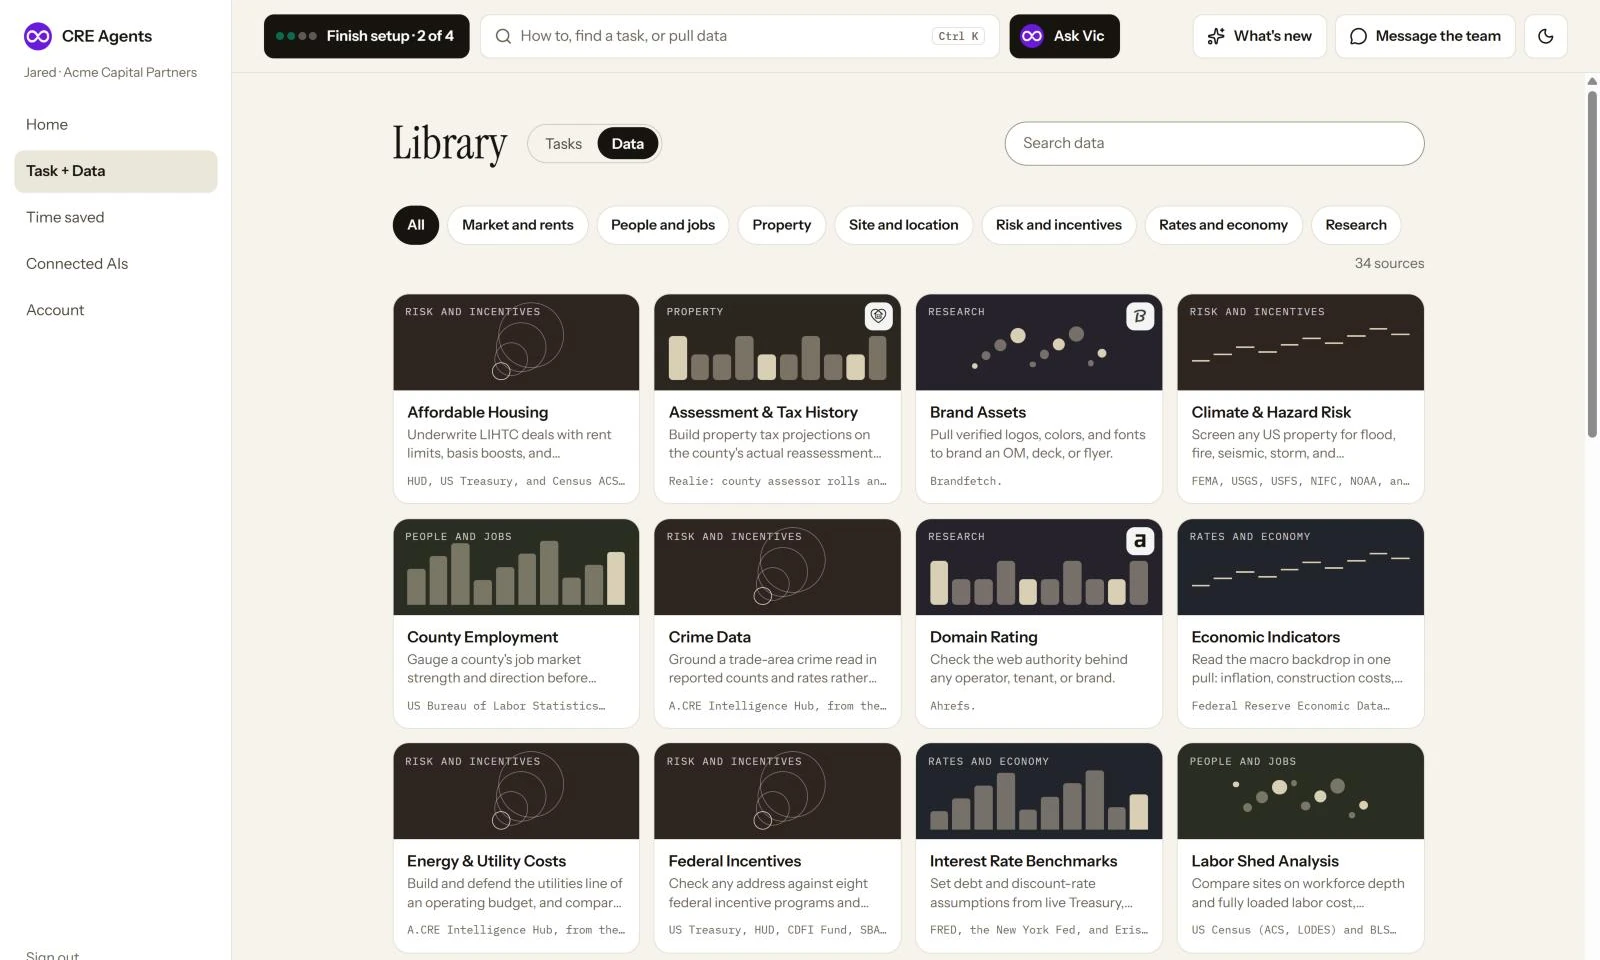
Section titled “Browse it in the portal”Open Task + Data and click the Data tab. Filter by group, or search. Click a source to see where the data comes from and what to ask for. Pull it with Vic gets you a file, and Copy an ask gives you a line to paste into your AI.
Your own data
Section titled “Your own data”Your files stay your best source for the deal in front of you. Attach a rent roll, a T12, a lease or your own market reports, and your AI works from them alongside the live data.
Next steps
Section titled “Next steps”© 2026 CRE Agents. All rights reserved.
AI can make mistakes. Please double-check responses. Not tax, legal, or investment advice.